Behavioural Atlas
A 3D network connecting biases, effects, and laws under the unifying behavioural principles they share.
Overview
Behavioural Atlas connects biases, laws, and fallacies that are usually studied in isolation, organising them under the unifying principles they share so the relationships between them can be explored.
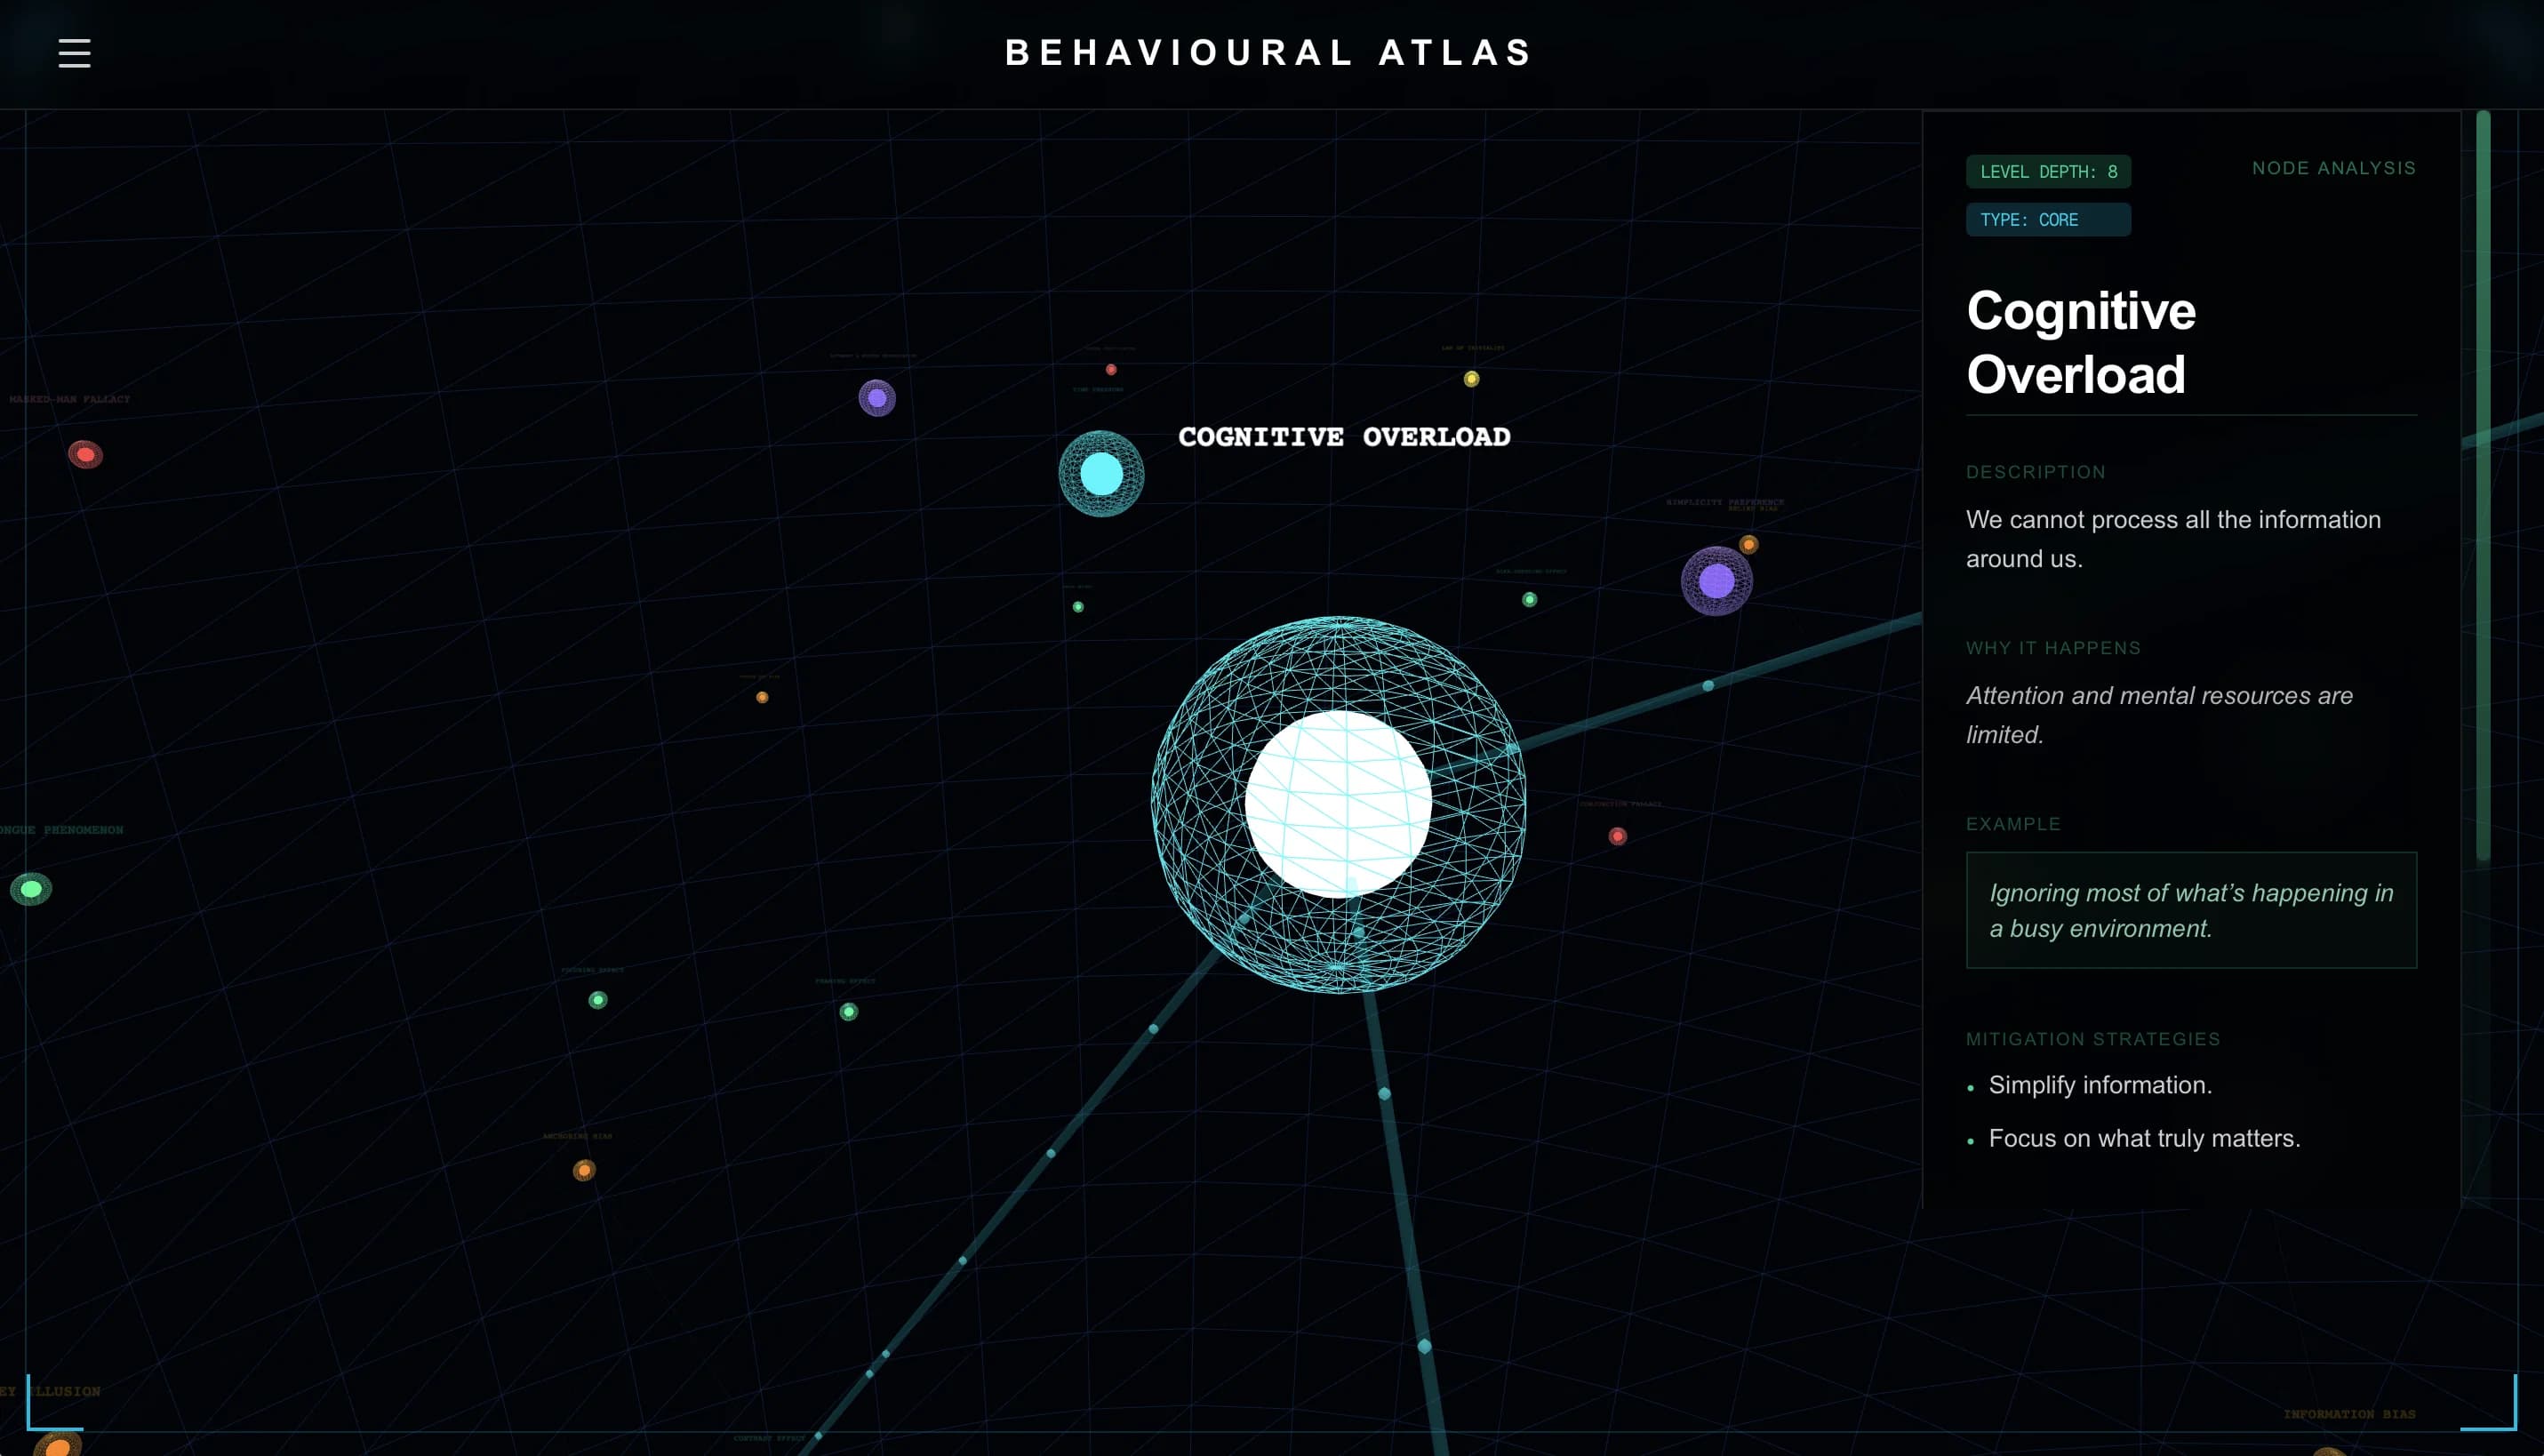
The network has three layers. Core cognitive domains sit at the centre, feeding into the mental processes they support, and those processes in turn connect to the behaviours they explain.
Network
Relational architecture
Every node in the network knows its type, its parent, and its weight, and the links between nodes are generated automatically from that structure. I wrote an equation that calculates how strongly two nodes are related based on their place in the hierarchy and the shape of the network around them.
The system was designed to scale from the start. Adding a new mechanism under a core automatically generates its links, its colour, and its physics behaviour.
Structure
Auto-generated behavioural library
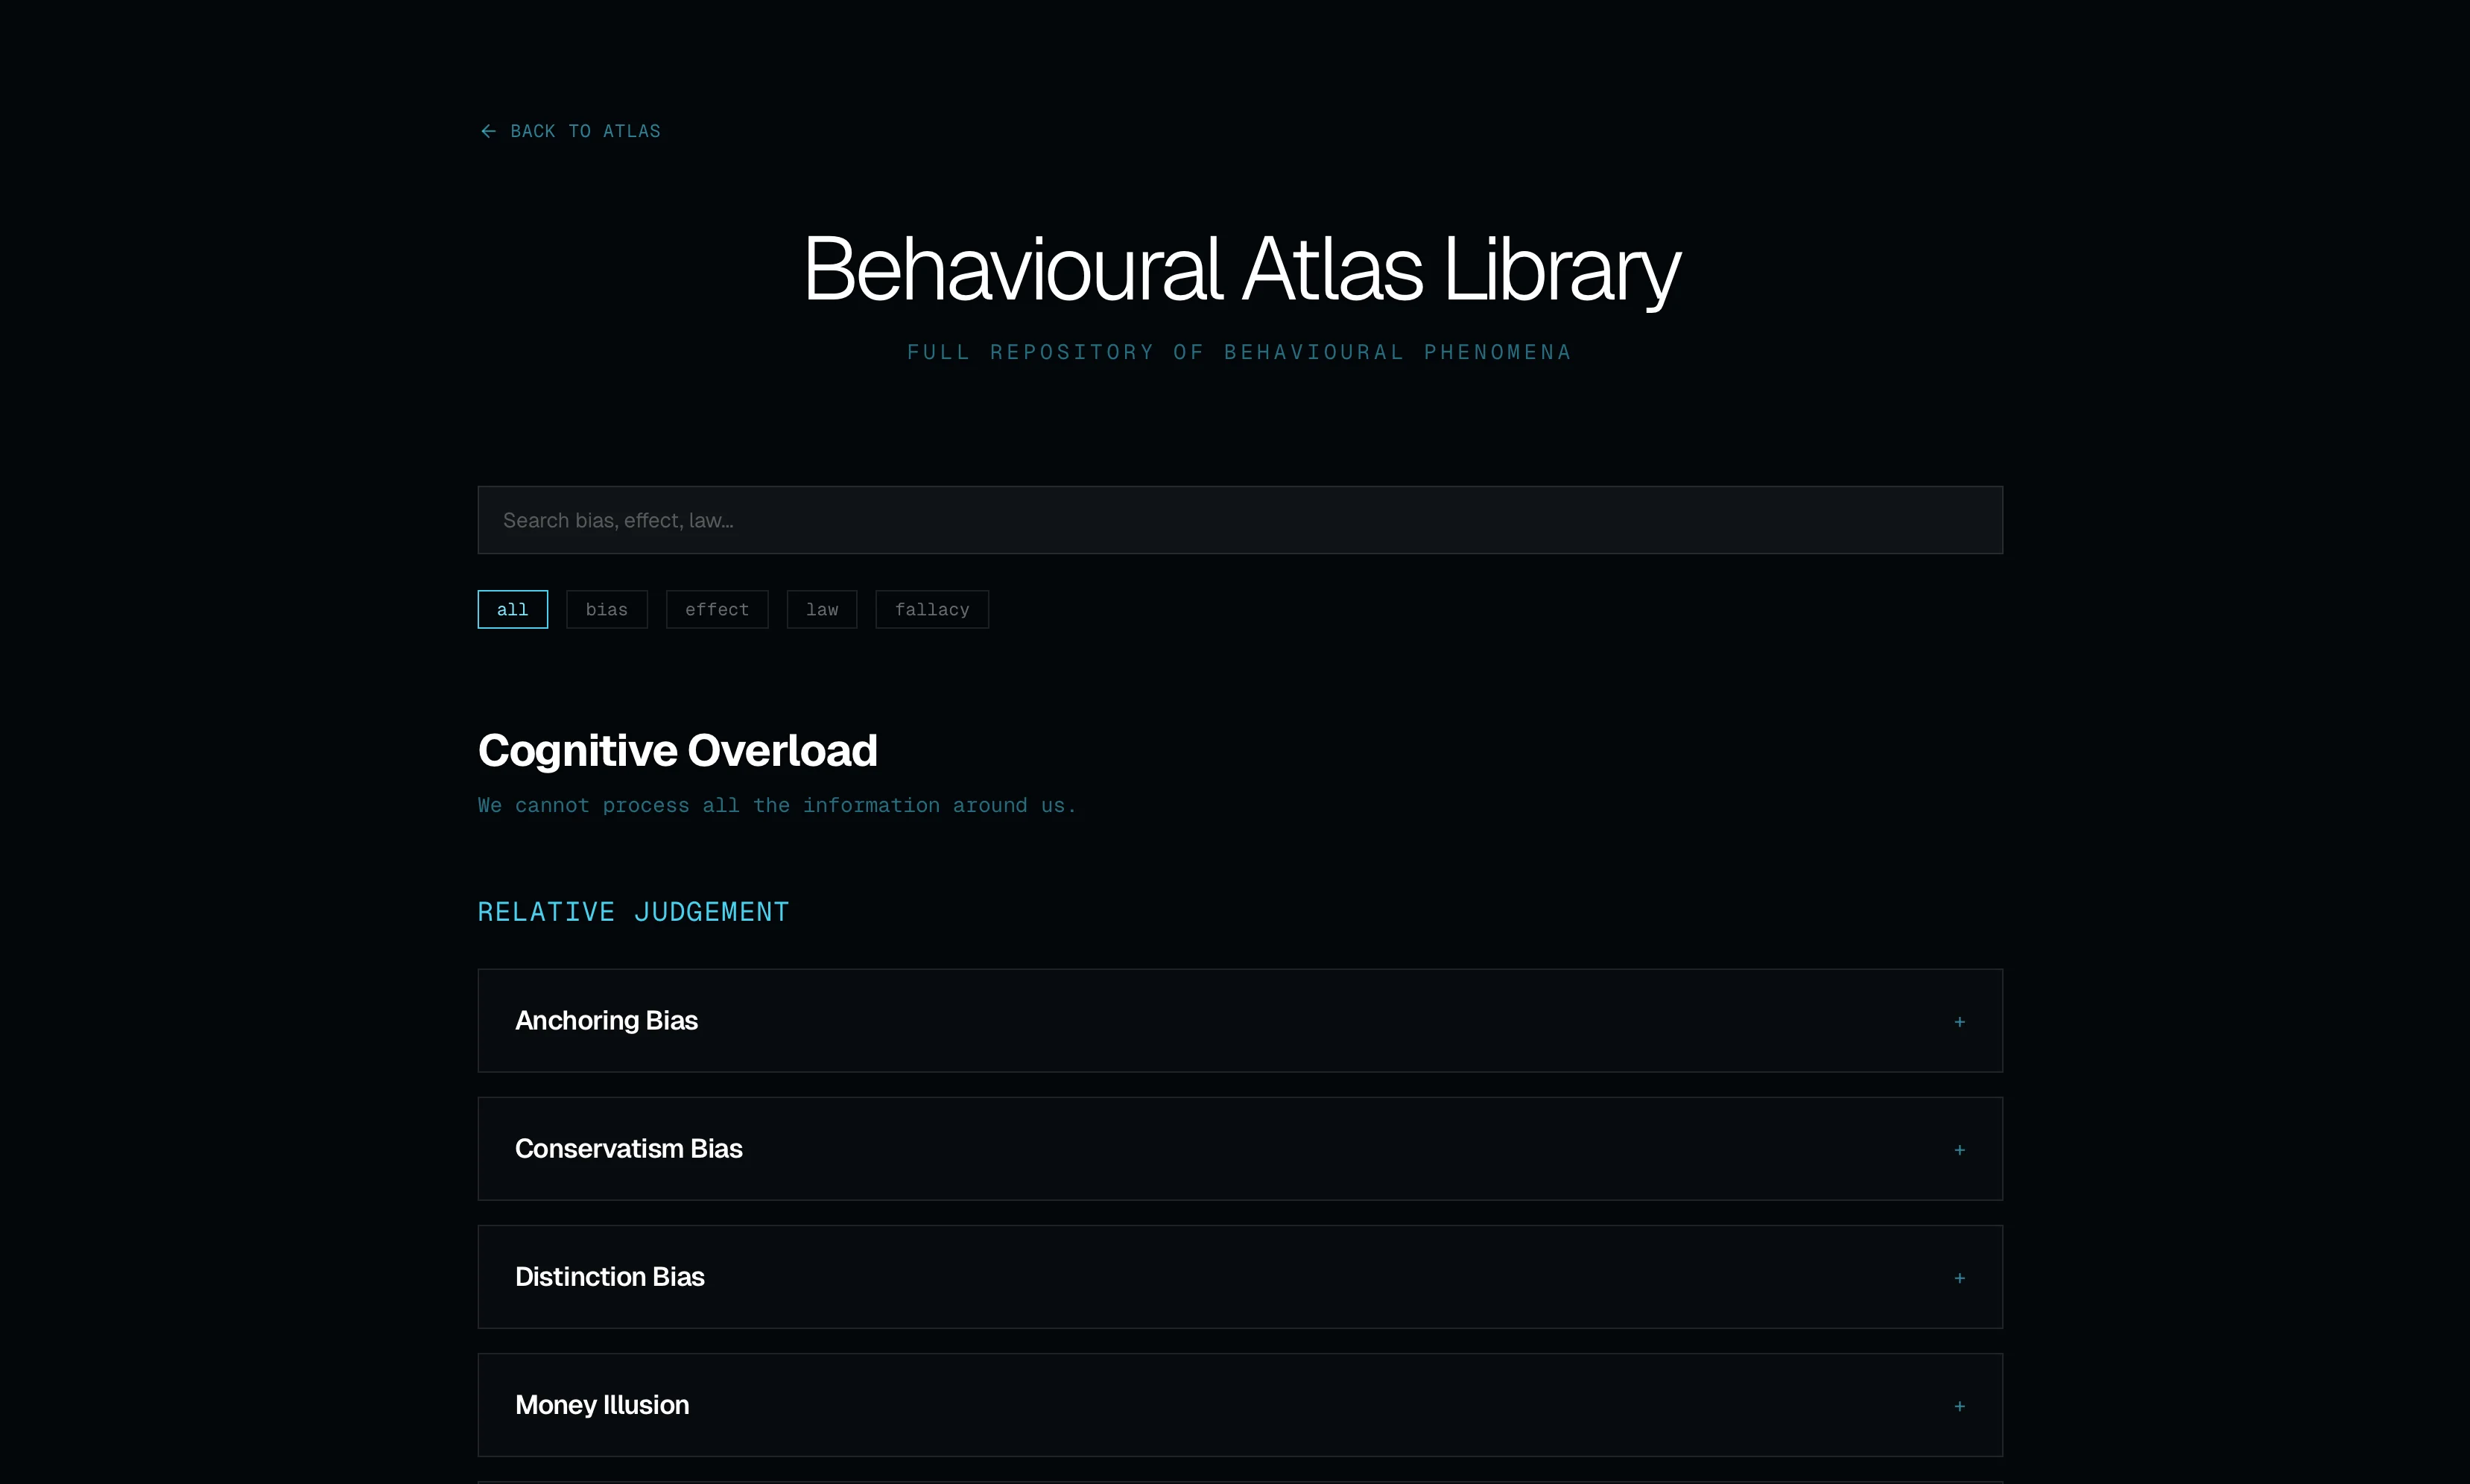
A library page lists every behaviour in the network, generated directly from the same data that powers the 3D graph. When a new bias, law, or fallacy is added to the dataset, it appears in the library automatically and inherits its place in the structure.
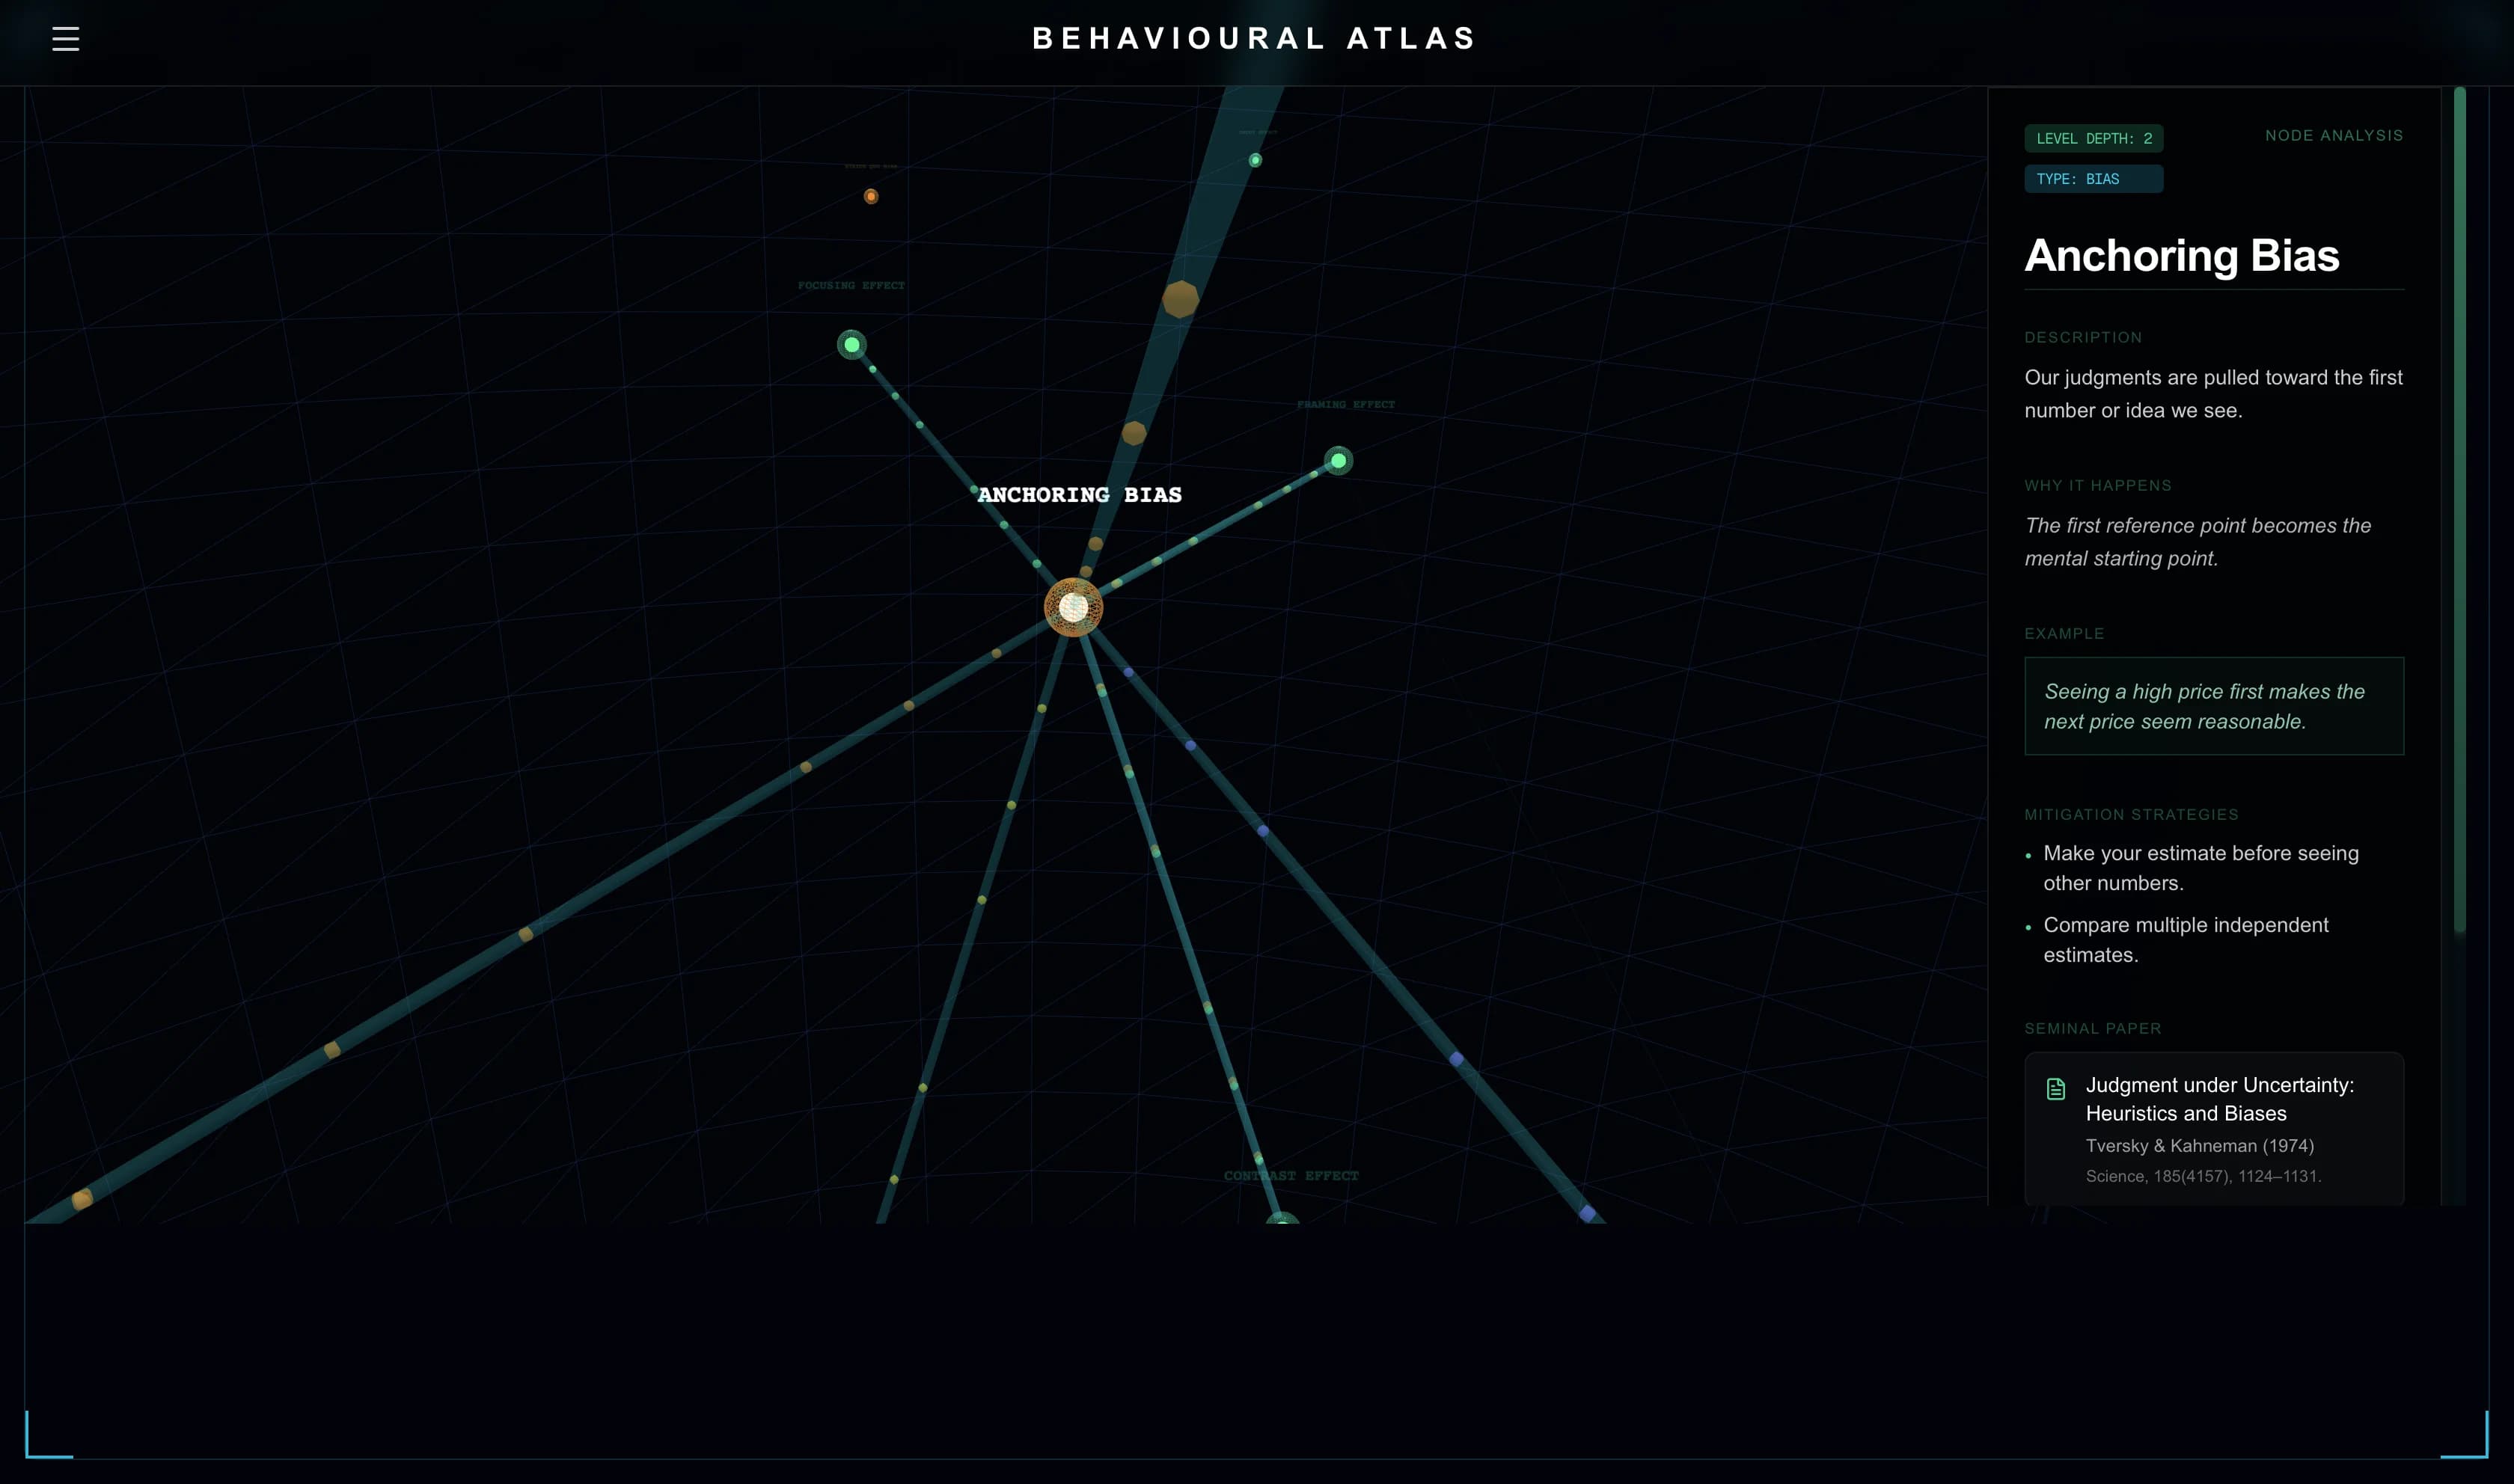
Each entry is deliberately short: a clear definition, one good example, and practical ways to counter the bias.
Library
Navigation and state logic
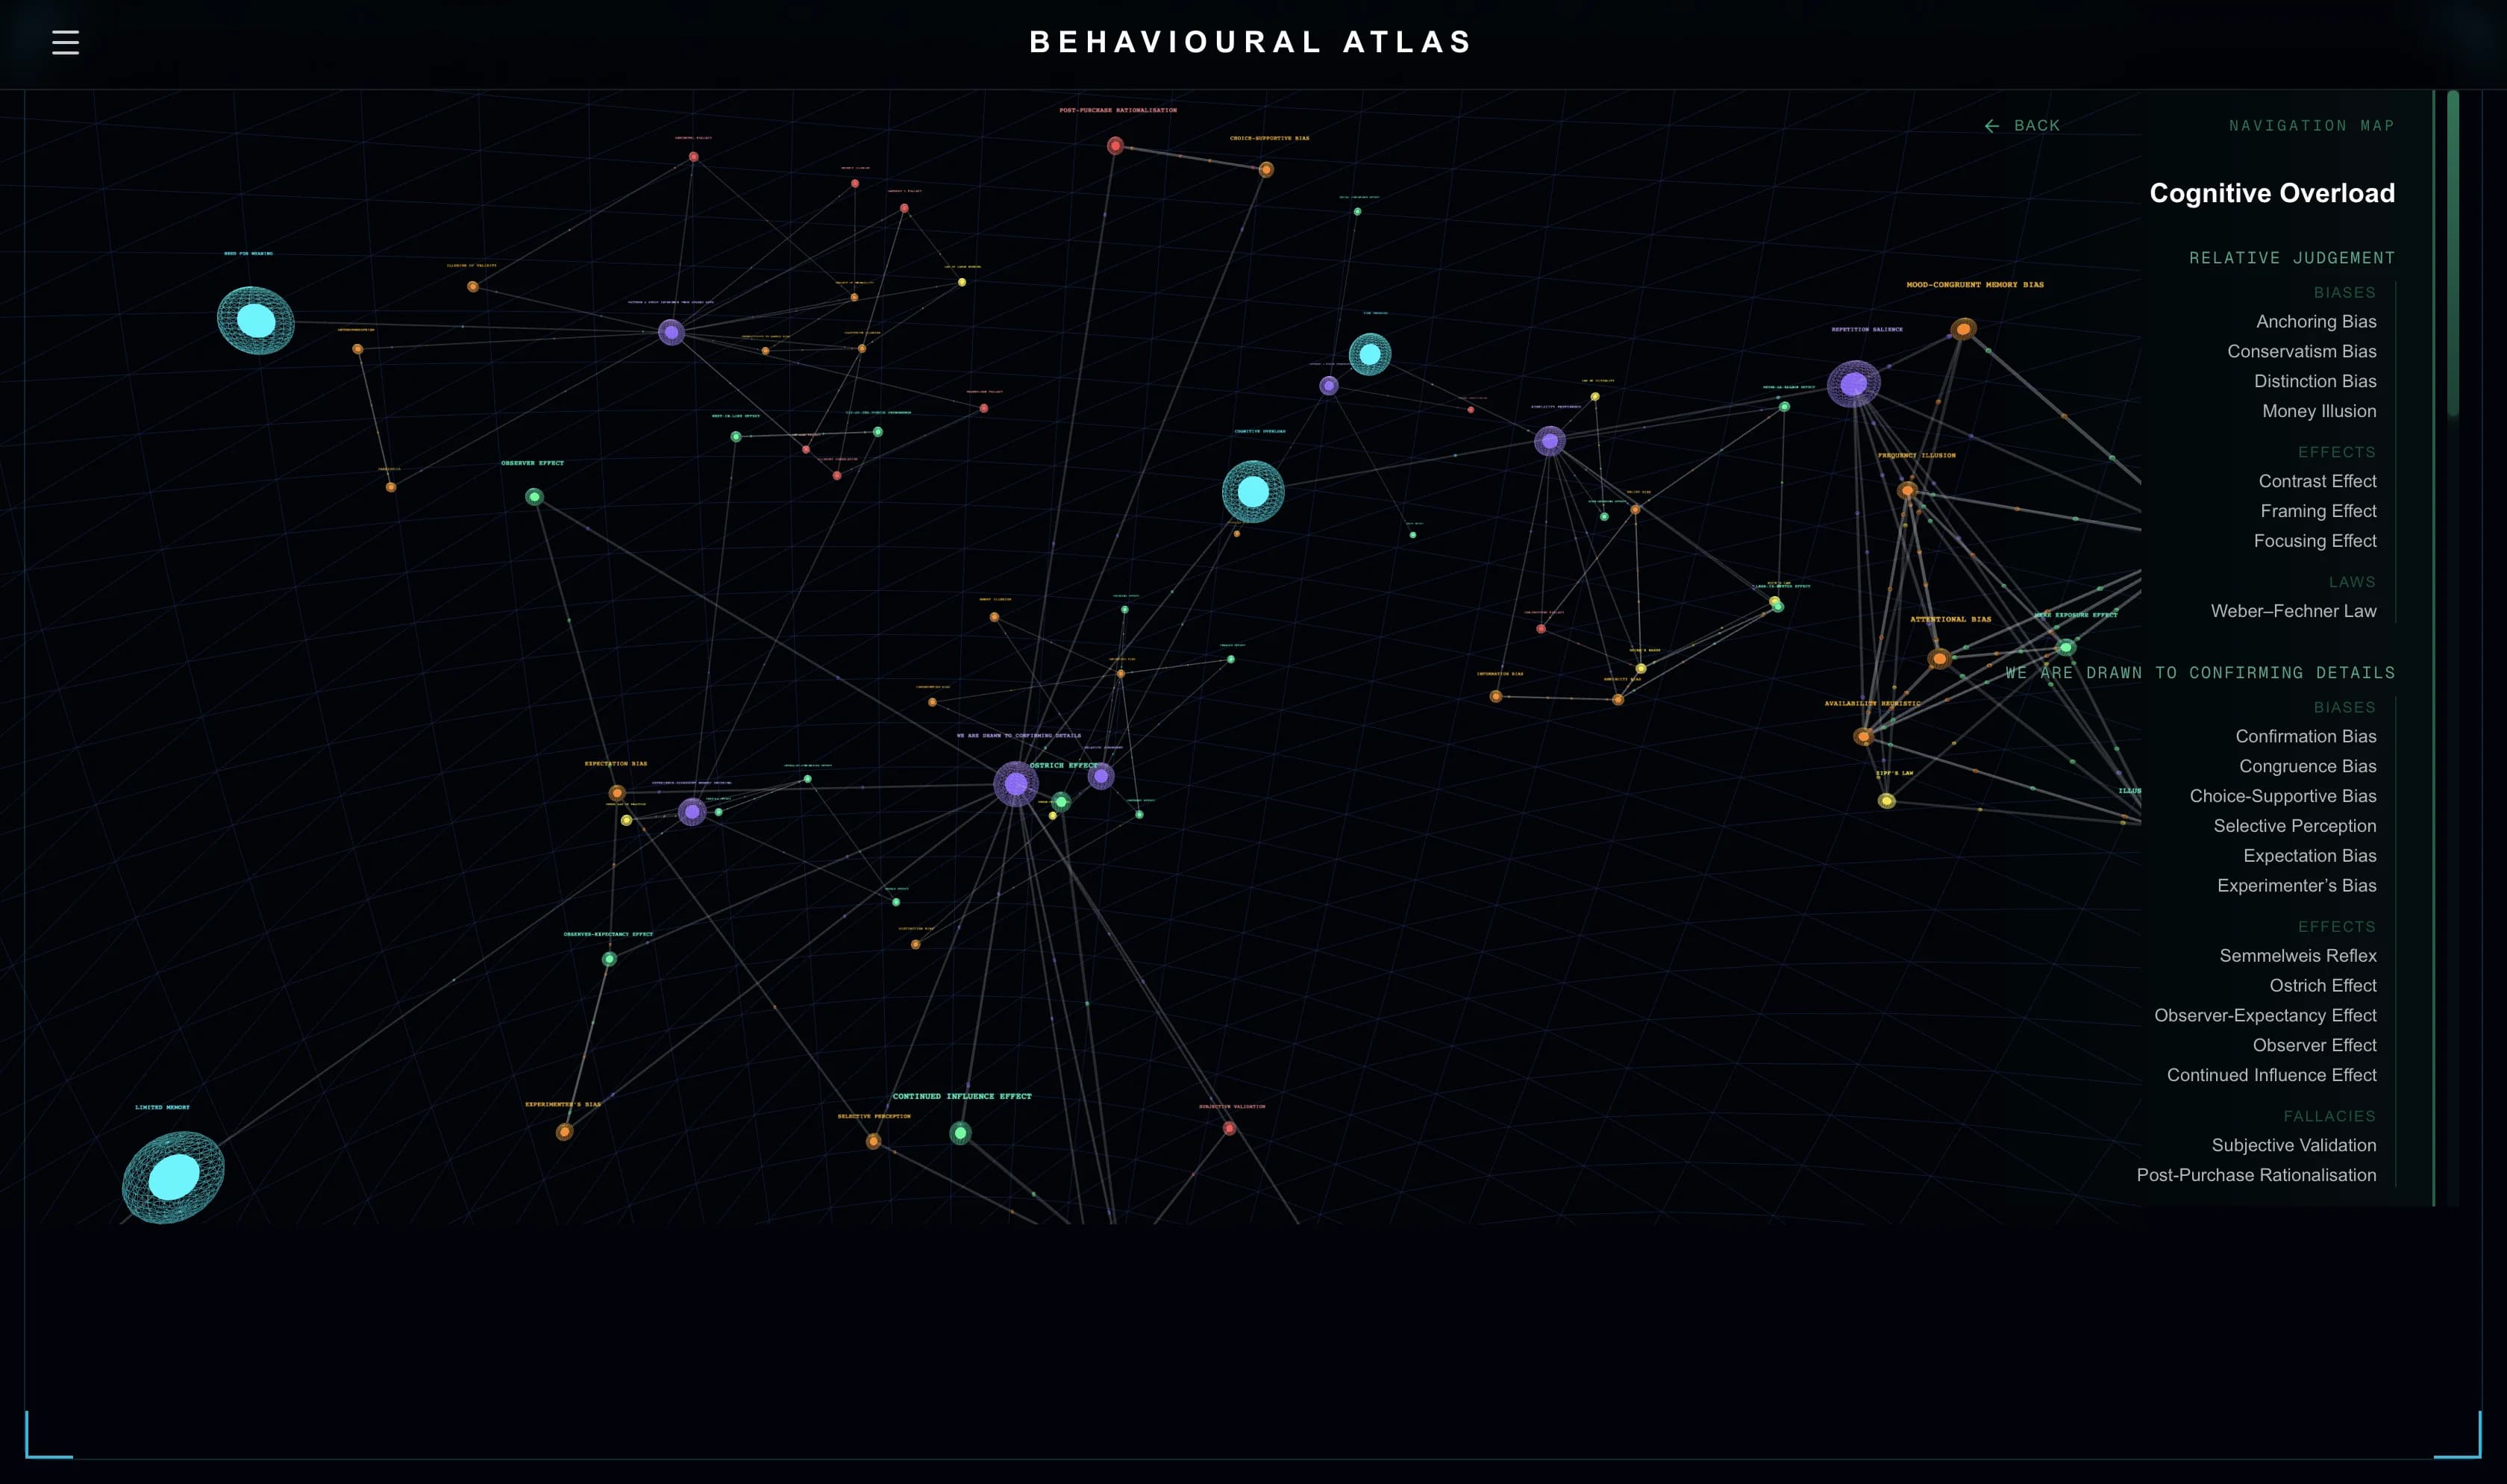
Zustand manages the application state, keeping selected nodes, camera transitions, and panels in sync across the whole interface.
I spent a long time refining the camera so that selecting a node feels smooth, adjusting how far it pulls back, how it eases into focus, and how it orients itself around the selection.
Making the 3D space work on mobile needed its own design pass. Camera angles, zoom limits, and label sizes were all recalibrated for smaller screens, and the information panels collapse into toggles while everything else behaves the same.
Navigable
Learning curve and technical growth
Three.js was equal parts fun and frustrating to learn, covering rendering performance, lighting, and how objects and text behave in 3D space. One early problem was that hovering over any node re-rendered the entire graph and caused noticeable lag, so I built a custom hover system that only updates the hovered node and its neighbours, which took a much deeper understanding of both React rendering and Three.js.
The physics of the graph needed similar tuning: how quickly it settles, how nodes cluster, and how far links stretch. The project also strengthened my understanding of the science itself, since designing the structure meant working out how biases actually emerge from deeper mechanisms. It was also just very interesting coming across new fallacies and biases that we so often fall for!
Detail
What this project represents
Behavioural Atlas took real time to design well. Formalising the relationships between mechanisms and behaviours sharpened my own understanding of how the mind is organised, and taught me to hold the big picture and the technical detail in view at the same time.
The system was built to grow indefinitely without rewrites, so every addition slots into the existing classification. It is both a knowledge map and a design exercise, and I hope it keeps expanding as I learn more about behaviour.
Built with
- TypeScript
- Next.js
- React
- Tailwind CSS
- Framer Motion
- Three.js
- Vercel
More projects